EE2.sad: Laboratory 2
[ Home | Syllabus | Exercises | Coursework | Exams ]
[
Design activity |
Lab 1: A,B,C |
Lab 2: A,B,C |
Groups ]
Instructions for the second laboratory (groups SQL, VB, XML and Z)
Just as for the first lab, you won't be able to finish the laboratory and the assignment during the supervised session (total 3-4 hrs work), so just try to get the most out of it and make as much headway as you can.
If you've got this far, then you'll have already logged in and opened a browser. The lab contains five exercises:
- Convert the logical ERD you are given into a physical one, using the CASE tool.
- Draw the level-1 logical DFD for your assigned process as part of the Mobile Phone System (groups SQL, VB, XML and Z).
- Sketch (by hand) the partial Structure Chart of all processes and subprocesses on your diagrams.
- Write a P-spec for your assigned subprocess, using structured English.
- Convert the logical level-1 DFD into a physical DFD.
Your performance will be assessed during the laboratory, but mostly from the completed work that you hand in for each of the five exercises.
You should ensure that all your work for this exercise, including your sketched DFD fragments, is stapled together and has your name and module code clearly marked on it. Copying or plagiarism will be severely penalised! Finally, here are some tips that might help you printing.
Submit your assignment to the undergraduate office in the usual way, clearly indicating your name, group and the module code (EE2.sad). For groups SQL, VB, XML and Z, the deadline to submit your coursework is 12 pm on Wednesday 26 Nov.
Getting started
- Just like last time, you need to fire up the Web Engineer CASE tool on Butters to be able to work on your designs. From the [Applications] menu, select [FEPS > Servers > Butters], which will connect you to that machine and open up a terminal window for you to enter commands. Type the Unix command "eng &" to invoke Web Engineer.
- This time, I have prepared the first part of the logical ERD in a repository that you'll need to download (groups SQL, VB, XML and Z) and install in your own workspace (right-click over the link and select [Save Link Target As...] and then save the file in your engineer directory).
- Move the mouse into the terminal window and click to make it active. Check that you can now see the compressed archive file in your engineer directory, called mobile.tar.gz, which you can do using "ls -l" to show the full details.
- To uncompress the file, type "gunzip <filename>".
- To unpack the tape archive (.tar), type "tar -xvf <filename>", which should show all the contents of the file being unpacked. Now you should have your own local copy of my repository.
-
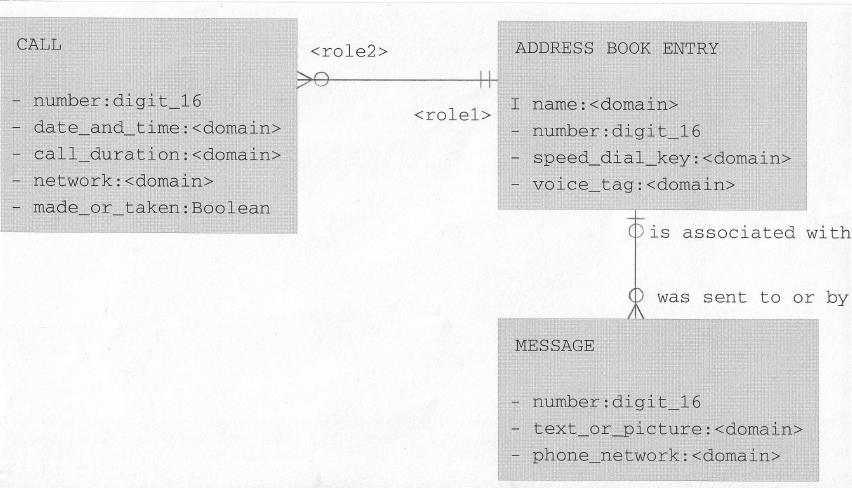
Open the repository in Web Engineer and develop the entity-relationship
diagram, from it's current state as a logical design into a
physical one.
Once you have opened the ERD, it should look something like this
(click to expand):
1. Turning a logical ERD into a physical design
You are now entering the design stage, and you therefore need to transform your logical model into a physical one. Treat each entity in turn, and follow the steps, as described in your System Design handouts and in chapter 8 of Dennis & Wixom:
- Convert names (e.g., as tables, data structures)
- Insert prefixes to attribute names
- Show identifiers and foreign keys
- Define how data to be stored:
- char, digit, int, float, bool
- arrays or lists, e.g., char[16]
- Add system-related components (e.g., internal storage, extra data needed for the implementation)
An example, taken from the air traffic control ERD that is in your notes,
is given, illustrating both the logical design:
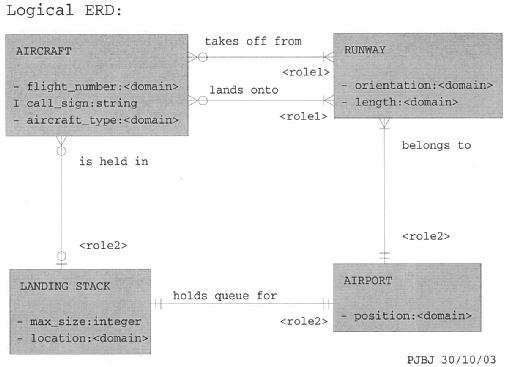
and the physical design:
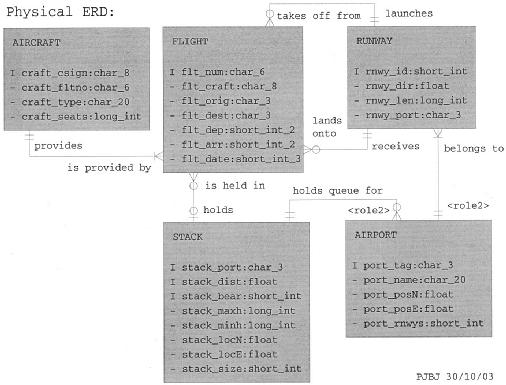
In this example, I've introduced an intersection entity, FLIGHT, to avoid having the many-many relationships that were between AIRCRAFT and RUNWAY. Like this, each instance of the FLIGHT entity will uniquely correspond to one aircraft and one runway for take off and one for landing.
2. Draw the level-1 logical DFD
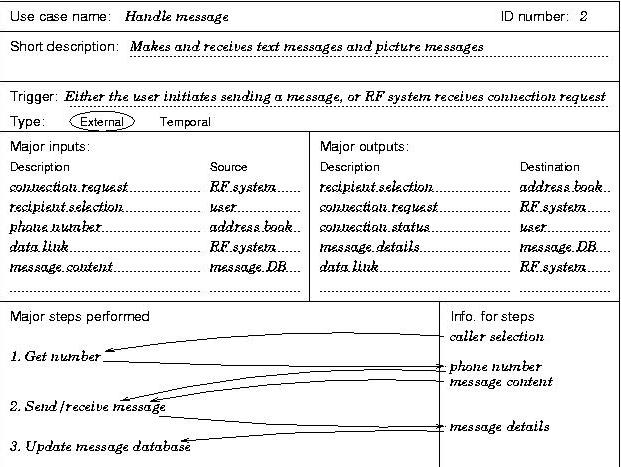
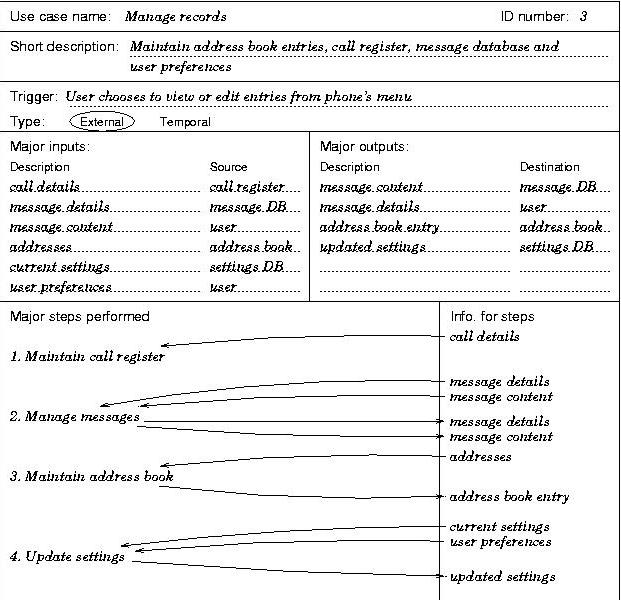
You will have been assigned a process that forms part of the Travel Booking System (Group 1). Using the information given in the lower portion of the scenario description, draw the level-1 logical DFD for that process.
For groups SQL, VB, XML and Z: scenario 1, scenario 2, scenario 3.Ensure that all the data flows are shown in order to provide your process' full functionality, and that your level-1 DFD is consistent with the level-0 DFD. Note that you may need to add some further detail to the scenario description to do this.
3. Sketch the partial Structure Chart
Sketch the partial Structure Chart of all processes and subprocesses on your diagrams. Using all the bubbles that have been defined so far (from the context diagram, through the level-0 DFD, down to the level-1 DFD), draw out by hand their invocation hierarchy using a structure chart. Include all the processes and subprocesses mentioned in the three scenario descriptions, down as far as level 1. This chart won't be totally complete, as there may be further information down at the lower levels, but for the sake of clarity you should not go any lower. You need not annotate the function calls in your structure chart with any data flows; just show the flow of control.
4. Write a Process specification
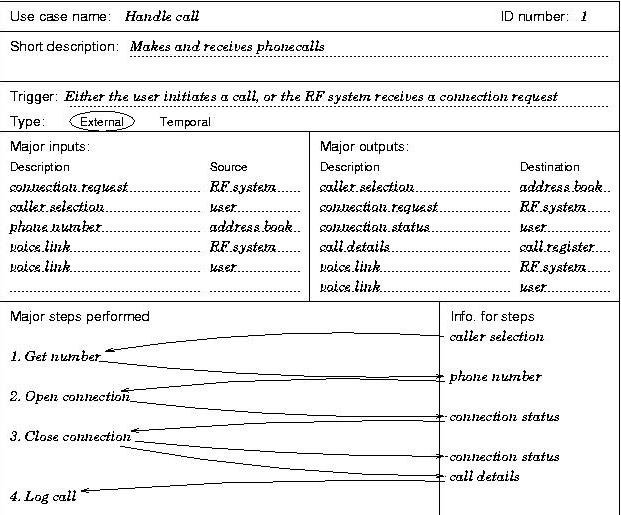
For this exercise, you are to write a process specification, or P-spec, for one of the subprocesses from your level-1 DFD.
Those given Process 1 should specify subprocess 1.2 (Open connection).Write the P-spec for your assigned subprocess using structured English. It should contain a list of the main steps needed to be able to complete the operation that the subprocess is to perform. A good example of this is given on page 51 of you notes (Fig. 47), and others can be found on pp. 27, 63, 70. There is also a short section on it in Dennis & Wixom, on pp. 177-178.
Those given Process 2 should specify subprocess 2.2 (Send/receive message).
Those given Process 3 should specify subprocess 3.3 (Maintain address book).
5. Convert the logical level-1 DFD into a physical DFD
Converting the logical level-1 DFD into a physical one is similar to the technique for ERDs. Treat each subprocess in turn, and follow the steps, as described in your System Design handouts and in chapter 8 of Dennis & Wixom:
- insert implementation references
- mark the scope of the system (i.e., the human-machine boundary)
- add system-related components
- update data elements
- update other metadata
As a minimum, the extra information given in the detailed design should include:
- the database format for each data store (e.g., MS Access, Oracle, Lotus Notes)
- the type and format of each data flow (e.g., Oracle table, four-digit code, email in ASCII)
- the language used to implement the main processes of the system (e.g., C, Pascal, Fortran, Basic, SQL, Perl)
Tips and sources of extra help
For each of the five exercises in this lab, the main thing is to read the
instructions carefully, and to apply what you have learnt in the lectures.
Below, I have listed some extra sources of information that should
help you understand what you are supposed to do more fully (the best
ones are in bold):
| Exercise | Lecture notes | Dennis & Wixom | Budgen [new ed.] |
|---|---|---|---|
| 1. Physical ERD | Example above and "Moving from logical to physical models" | System design (ch.8, pt.2), and Data modelling (ch.7) | |
| 2. Level-1 DFD (logical) | "Process modelling" (§6.2) | Process modelling (ch.6) | |
| 3. Structure chart | "Structure chart" (§6.5) | Program design (ch.12, pp.390-400) | pp.108-111 [158-161] |
| 4. Process specification | "Structured systems analysis" (§9.2) and "Pseudocode" (§6.1) | Structured English on pp.177-178 | As pseudo code, pp.120-122 [166-168] |
| 5. Level-1 DFD (physical) | §6.2 and "Moving from logical to physical models" | System design (ch.8, pt.2) |
In the CASE tool, Web engineer, you can change both the cardinality and the modality of a relationship in an ERD with the "change degree" option. The cardinality refers to the maximum number of instances of a given entity that may be related, and is typically single or many. The modality refers to the minimum number of instances of a given entity that may be related, and is typically zero or one, making the relationship optional or mandatory. If you try changing these in the CASE tool, you'll soon see how they should be drawn.
As an alternative to the Web Engineer CASE tool, you might choose to use a simpler utility, Dia, for drawing ERDs and DFDs. Just enter "dia &" in a terminal window and it will fire it up. DFDs can be drawn using the "Gane and Sarson" option, and ERDs with "ER". As you will see, there are plenty of other diagram notations that it provides, including UML. There is also a package called Umbrello on our system that provides for diagramming using UML notation, and of course Microsoft Visio. For structure charts, I like to use xfig but you could use Powerpoint or any other drawing package.
If you have any other specific questions, you can email me.