EEM.ssr: Tutorial questions
Week 1
Speech recognition:- Give a definition of automatic speech recognition that distinguishes it from other speech technologies.
- How can speech technologies be said to increase access of people with disabilities to computer-based systems?
- What acronym denotes the convention for transcribing the sounds of the world's languages?
- What is the difference between phones and phonemes?
- What three attributes of natural speech contribute most to the non-linguistic aspects known as prosody?
- How can a basic understanding of phonetics facilitate the study of speech signals?
- What is a diphthong? Illustrate your answer with an example.
- What class of sounds includes /m/, /n/ and /ŋ/ (or /m,n,N/ in SAMPA)?
- What characteristics of the acoustic signal are most useful for discriminating vowels?
- Give three environmental factors that can affect the way speech is produced.
- What are the three places of articulation for English plosive consonants (a.k.a. stops )?
- What is the main difference between the way that the sounds /t/ and /s/ are produced?
- What name is given to the effect in fluent speech where, for example, the phrase ``isn't it'' is pronounced as if it were ``in'it''?
Week 2
Dynamic Time Warping:
|
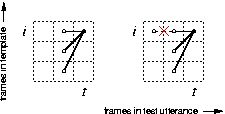
Fig.1. Permissible DTW transitions. |
- What human organ produces quasi-periodic source of voiced sounds, such as vowels?
- What is fundamental frequency (also called f0), and how is it produced?
- The vocal tract comprises three main passages. The pharynx and oral cavity are two. What is the third?
- The velum, larynx and jaw cooperate in the production of speech. Name two other articulators.
- What is a formant and how is it produced?
- What is the name of the organ in the inner ear that is responsible for converting physical vibrations into a set of nerve responses (i.e., electrical signals)?
- What is the bandwidth to which the human ear responds (to one significant figure), and what are the implications?
- If I calculate a DFT directly from a 40ms section of a speech signal, what will be the spacing of frequency bins in the spectrum?
- Boxcar (rectangular), Kaiser and Blackman define certain kinds of window. Name three other popular window functions.
- What would be an appropriate window size for a narrow-band spectrogram? [Hint: male f0 80-200Hz, female f0 150-400Hz]
- Give an estimate of the SNR for a full-scale 16-bit speech signal in relation to the quantisation noise.
Week 3
Markov models:
-
Given an initial state vector π = [0.25 0.50 0.25], and
state-transition probability matrix
A = [0.25 0.50 0.25; 0.00 0.25 0.50; 0.00 0.00 0.25]:
- draw the model to show the states and permissible transitions;
- calculate the probability of the state sequence X = {1, 2, 2, 3}
- Using the Markov model presented in the lectures,
if today (Monday) has been rainy, what is the most likely weather
- tomorrow,
- in two days' time (i.e., on Wednesday)?
- Calculate the probabilities of rain-rain-sun, rain-cloud-sun and rain-sun-sun, assuming πrain = 1.
- Hence, if we are told that it will be sunny on Wednesday for certain and that it's rainy today, what's the most likely weather tomorrow?
|
|
(a) 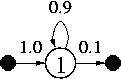 (b) 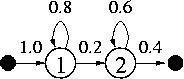
Fig.2. HMM state transitions. |
- How can a bank of band-pass filters (each tuned to a different centre frequency) be used to extract a feature vector that describes the overall spectral shape of an acoustic signal at any particular time?
- The real cepstrum of a digital signal sampled at 48 kHz is defined as cs(m) = IDFT( ln|S(k)| ), where S(k) is the signal's discrete Fourier spectrum, ln|.| denotes the natural logarithm and IDFT is the inverse discrete Fourier transform. Considering only real, symmetric elements in the log-magnitude spectrum (i.e., the cos terms), draw the shapes of the first four cepstral coefficients c0, c1, c2 and c3, in the log-magnitude spectral domain.
- What properties of the Mel-frequency cepstrum make it more like human auditory processing, compared to the real cepstrum?
- In calculating MFCCs, what is the purpose of:
- the log operation;
- mel-frequency binning;
- Discrete Cosine Transform?
Week 4
Hidden Markov models:
- Draw a trellis diagram for the HMM in Fig.2(b) and a 5-frame observation
sequence.
- Show all the paths that arrive in the final null node after the fifth frame.
- How many different paths are there for this model and number of observations?
- Imagine you are designing an optical character recognition (OCR) system
for converting images of written words into text, based on HMMs.
The observations you're given come in the form of pixellated grey-scale bitmaps
of a single line of writing.
Explain in general terms how you would construct the following components of the
system:
- frames of feature vectors to make up the observation sequences;
- the models (each one comprising a state or set of states);
- suitable annotations to be used during training;
- any special models (e.g., for dealing with blotches or blank spaces within the pictures).
- How do the components of the OCR system compare to those for an ASR system designed to perform an Isolated Word Recognition task?
Week 5
HMM decoding:
- In the Viterbi algorithm, what is the purpose of the variable ψt(i)?
- What is the meaning of Δ*?
- Using the Viterbi algorithm, calculate the path likelihoods
δt(i), the value of
Δ*, and use the values of
ψt(i) to extract the best path X*:
- for observations O¹={G,B,B} (worked example from lecture)
- for observations O²={R,B}
- What is the difference between the cumulative likelihoods αt(i) computed in the forward procedure, and those δt(i) computed in the Viterbi algorithm?
- Floating-point variables with double precision (i.e.,
4 bytes) can store values down to 1e-308, typical state-transition
probs are in the order of 0.1, and the multi-dimensional output probability
would be around 0.01 for a good match.
- Given these approximations and assuming no re-scaling of the probabilities, state at what stage would it become impossible to compare competing hypotheses (i.e., different paths through the trellis)? In other words, after how many observations would you expect the likelihoods to suffer from numerical underflow?
- With an observation frame rate of 10 ms, roughly how long would this take?
- Instead of storing the likelihoods directly as in the previous
question, we choose to store them as negative log probabilities using a 16-bit
unsigned integer (quantising each decade into 32 levels).
- How many decades (factors of ten) can we represent with this data type?
- How many seconds of observations (at 10 ms) could we now process before suffering from underflow?
Week 6
HMM training:
- Using the observation sequences O¹ and O² from Q.3 (week 5) and your derived Viterbi alignments X*¹ and X*², update the model parameters π, A, η and B according to the Viterbi re-estimation for multiple files.
- Assuming initial values of a prototype model to be
π=[1 0], A=[0.5 0.5; 0.0 0.5],
η=[0 0.5]T, B=[1/3 1/3 1/3; 1/3 1/3 1/3]:
- Calculate the forward and backward likelihoods, α and β, for the first set of observations O¹={G,B,B}.
- Calculate the occupation and transition likelihoods, γ and ξ.
- Use the Baum-Welch formulae, which is an implementation of the Expectation Maximisation procedure, to re-estimate values for π, A, η and B.
- Derive an expression for Baum-Welch re-estimation using multiple training files for the case of the discrete HMM.
- Based on a univariate Gaussian pdf, bi(ot), derive an expression for the negative log probability density (neg-log-prob, -ln bi) in the form of three terms: a constant, a term dependent only on the variance, and a term dependent on the observations.
-
- Derive the maximum likelihood (ML) estimate of the mean μ from a known
set of scalar observations, assuming a Gaussian pdf.
[Hint: write the likelihood function as a log probability, and then differentiate.] - Derive the ML estimate of the variance Σ in the same way.
- Derive the maximum likelihood (ML) estimate of the mean μ from a known
set of scalar observations, assuming a Gaussian pdf.
- A 2-dimensional feature vector is made up of two independent observations
which have standard deviations of 2 and 3 units respectively.
- What are the variances of each of the two dimensions of the observation vector, ot=[o1(t) o2(t)]T?
- Hence, write down the 2×2 covariance matrix Σ for ot.
- Evaluate the determinant of this matrix, |Σ|.
- Sketch the following pdfs by drawing contours of equal probability
density:
- μ=[0 0]T, Σ=[1 0; 0 ¼];
- μ=[3 2]T, Σ=[4 0; 0 9];
- μ=[2 -2]T, Σ=[2 1; 1 2];
- μ=[-2 -2]T, Σ=[2 -1; -1 2].
- Sketch the pdf for Gaussian mixtures with the following parameters:
- Univariate: c1=1/3, μ1=0, Σ1=1 and c2=2/3, μ2=3, Σ2=1;
- Bivariate: c1=½, μ1=[4; 4], Σ1=[2 1; 1 2] and c2=½, μ2=[4; 4], Σ2=[2 -1; -1 2].
- Derive expressions for training Gaussian-mixture output pdfs using
multiple files:
- for Viterbi re-estimation;
- for Baum-Welch re-estimation.