The University of Surrey

EE2.LabA: Microphone Frequency Response


Teams: 2-4 members per group
Software: Pure Data (pd), v. 0.39 or later
Timetable: One week allocated.

Aims of the Experiment

Equipment

Overview

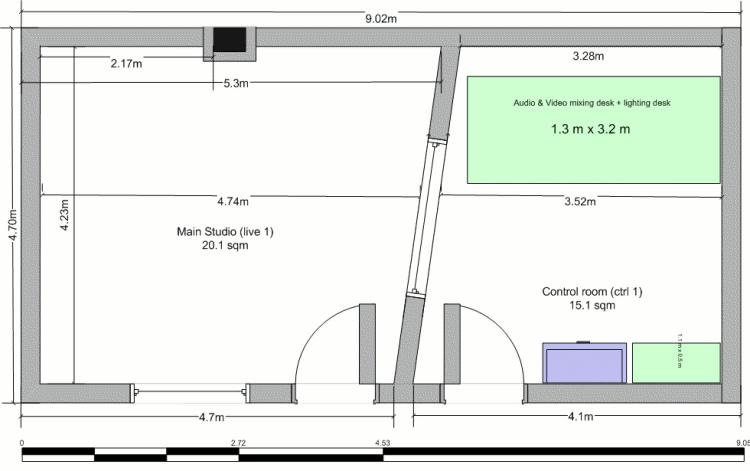
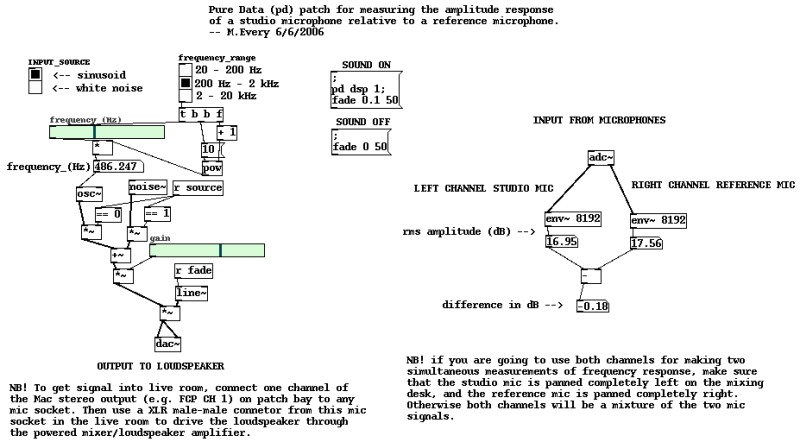
The experiment measures the frequency responses of two test mics using a high-quality condenser mic (AKG C414B) with a known response as a reference. A sinusoidal test signal will be synthesized and microphone responses to the sinusoidal signal measured using Pure Data (pd): a real-time graphical programming environment or patcher language. A studio monitor with a nominally flat frequency response will be placed in the live room, and the reference and test mics will be mounted 1m in front of it. All signals will be patched to/from the control room. Frequency responses will be measured over the approximate audible frequency range 40 Hz - 20 kHz, and all measurements will be calibrated against an estimated room response.

Preparation

Figure 1: Studio floor plan

Hardware and Software Setup

Explanation of the test patch

Figure 2: Test patch for microphone response measurement

The LHS of the pd patch 'sin_generator.pd' (above) synthesizes the test signal that is fed into the loudspeaker. DSP I/O is turned on and off by mouse-clicking the SOUND ON/OFF boxes. There is an option to output either a sinusoidal signal or a white noise signal, but we will be using only the sinusoidal generator. The gain of either can be controlled using a slider, and the sinusoidal frequency can be controlled using the frequency_range selector and frequency slider. The RHS of the patch measures the RMS amplitude of the input signal. The adc~ object performs an A/D conversion, based on the stereo output of the USB interface. The RMS amplitude of both channels can be measured using the object env~ (output in dB). env~ is supplied with an additional parameter which specifies the number of samples over which to average the RMS amplitude. Keep this at 8192 samples (approximately 200 ms at a sampling rate of 44.1 kHz).

Measurements

  1. Plot the known frequency response of the reference mic at 3-rd octave intervals between 40 Hz and 20 kHz (this should be on a calibration chart in the microphone box), scaled to 0dB at 1kHz.
  2. Now measure the response of the reference microphone over the same frequency range, and adjust the overall response so that a 0dB point occurs at 1kHz. Subtract this from the known response given in the technical specification. Is the result flat? Are you able to observe any of the room modes calculated in the preparation?
  3. Move the reference mic 2 cm to the left and re-measure the frequency response. Account for any differences between the two measurements.
  4. For each of the two test microphones: mount the mic on a stand in exactly the same position the reference mic was in, and adjust the gain on the mixing desk until the response measured at 1kHz is 0dB. Now measure the frequency response of the test mic. Calibrate this against the room response at this position to get the actual microphone response.
  5. Plot the frequency responses of the reference and test microphones, after accounting for room effects, all on the same axes, and comment on the individual characteristics/limitations of the microphones. (It will probably not come of any surprise that the mics are in order of increasing price: Behringer XM1800S, Shure SM58, AKG C414B.)
  6. The frequency response of the monitor was not accounted for in these measurements as it was claimed to be nominally flat. Is this justified, and how could it affect the microphone response measurements?


Dept.
[ Home ]

© 2004-12, written by Mark Every, maintained by Philip Jackson, last updated by Phil Coleman on 20 Oct 2012.


Faculty